Visual Indicators for Acid-Base Titrations
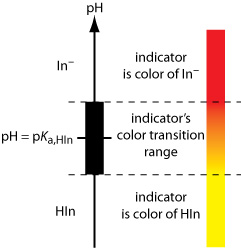
The illustration below shows the relationship between pH and an indicator’s color. The ladder diagram defines pH values where each of the indicator’s two forms the weak acid form, HIn, which in […]

Get a look at images, photos, videos, and animations that encompass many facets of teaching and learning about analytical chemistry.
The illustration below shows the relationship between pH and an indicator’s color. The ladder diagram defines pH values where each of the indicator’s two forms the weak acid form, HIn, which in […]