Microtitrations
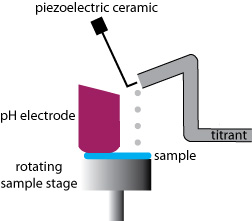
The illustrations below show two approaches to titrating very small samples. In the first experimental design, samples of 20–100 µL were held by capillary action between a flat-surface pH electrode and a stainless […]

Get a look at images, photos, videos, and animations that encompass many facets of teaching and learning about analytical chemistry.
The illustrations below show two approaches to titrating very small samples. In the first experimental design, samples of 20–100 µL were held by capillary action between a flat-surface pH electrode and a stainless […]
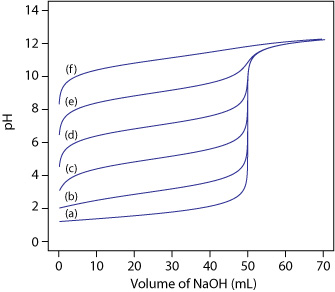
In an acid–base titration the volume of titrant needed to reach the equivalence point is proportional to the moles of titrand. Because the pH of the titrand or the titrant is a […]
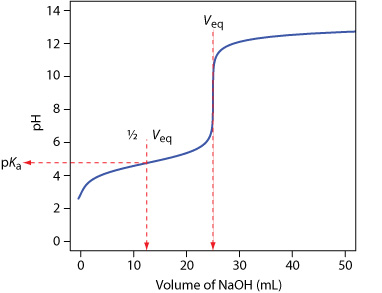
Another application of acid–base titrimetry is the determination of equilibrium constants. Consider, for example, a solution of acetic acid, CH3COOH, for which the dissociation constant is Ka = [H3O+][CH3COO–]/[CH3COOH] When the concentrations […]
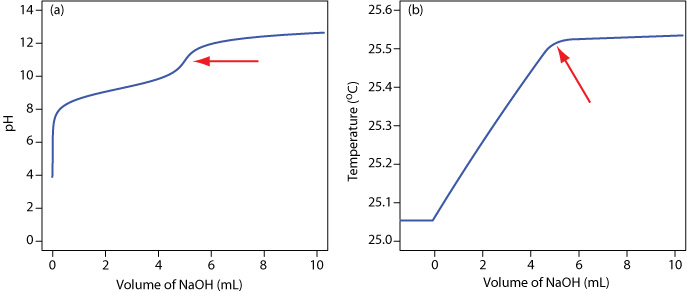
An alternative to using a visual indicator to locate a titration’s end point is to continuously monitor the titration’s progress using a sensor whose signal is a function of the analyte’s concentration. […]
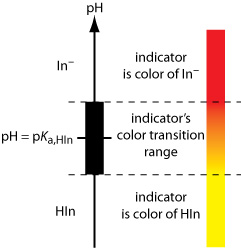
The illustration below shows the relationship between pH and an indicator’s color. The ladder diagram defines pH values where each of the indicator’s two forms the weak acid form, HIn, which in […]
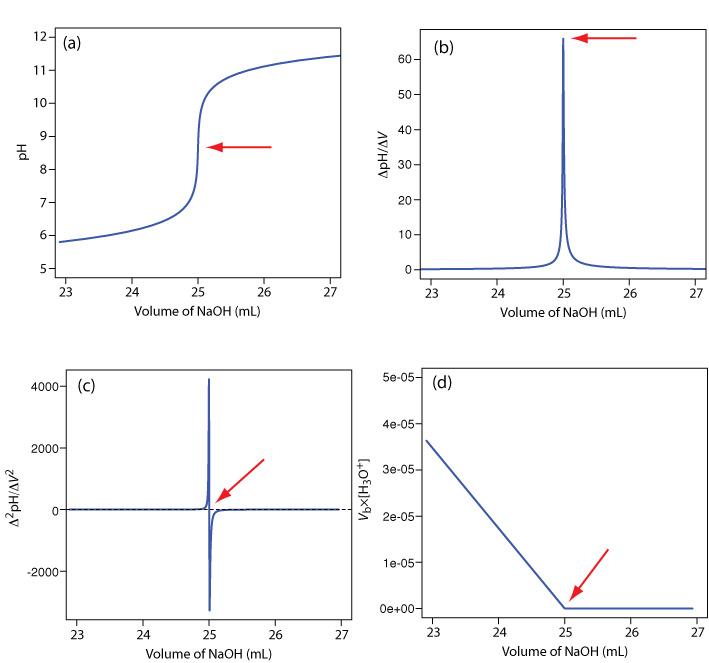
For most acid–base titrations the inflection point, the point on a titration curve having the greatest slope, very nearly coincides with the equivalence point. The red arrows in the following figure for […]