Fiagrams
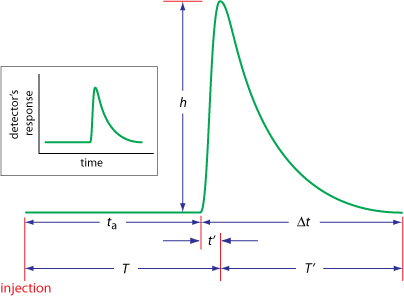
An FIA curve, or fiagram, is a plot of the detector’s signal as a function of time. The illustration below shows a typical fiagram for conditions in which both convection and diffusion […]

Get a look at images, photos, videos, and animations that encompass many facets of teaching and learning about analytical chemistry.
An FIA curve, or fiagram, is a plot of the detector’s signal as a function of time. The illustration below shows a typical fiagram for conditions in which both convection and diffusion […]