t-Test
The figure below shows the relationship between confidence intervals and the result of a t-test. (a) The shaded area under the normal distribution curve shows the confidence interval for the sample based […]

Get a look at images, photos, videos, and animations that encompass many facets of teaching and learning about analytical chemistry.
The figure below shows the relationship between confidence intervals and the result of a t-test. (a) The shaded area under the normal distribution curve shows the confidence interval for the sample based […]
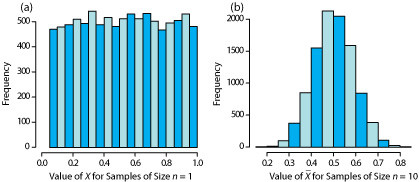
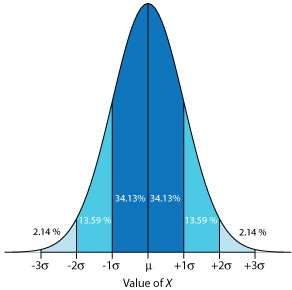
According to the central limit theorem, when an analysis is subject to a variety of indeterminate errors, the distribution of results for that analysis will approximate a normal distribution. As the number […]
A binomial distribution describes a population whose members have only certain, discrete values. This is the case with the number of 13C atoms in cholesterol. A molecule of cholesterol, for example, can […]