
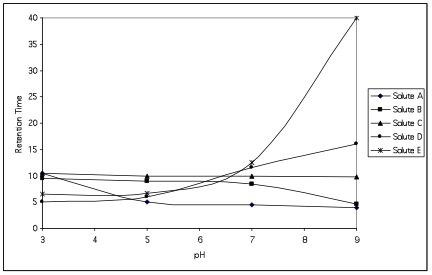
The graph shown below is a plot of retention time vs. pH for the reverse-phase HPLC separation of a mixture containing phenacetin, salicylic acid, nicotine, methylamphetamine, and phenobarbituic acid.

Based on the structures of these compounds and their pKa values, match each compound to one of the five curves. Be sure to clearly justify your reasoning.

