Property Control Charts
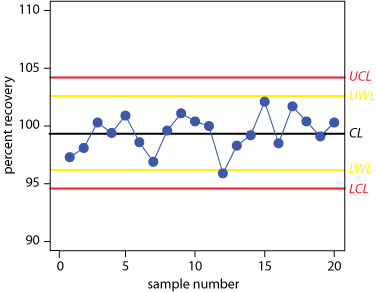
Control charts were originally developed in the 1920s as a quality assurance tool for the control of manufactured products. Although there are many types of control charts, the most common in a […]

Control charts were originally developed in the 1920s as a quality assurance tool for the control of manufactured products. Although there are many types of control charts, the most common in a […]
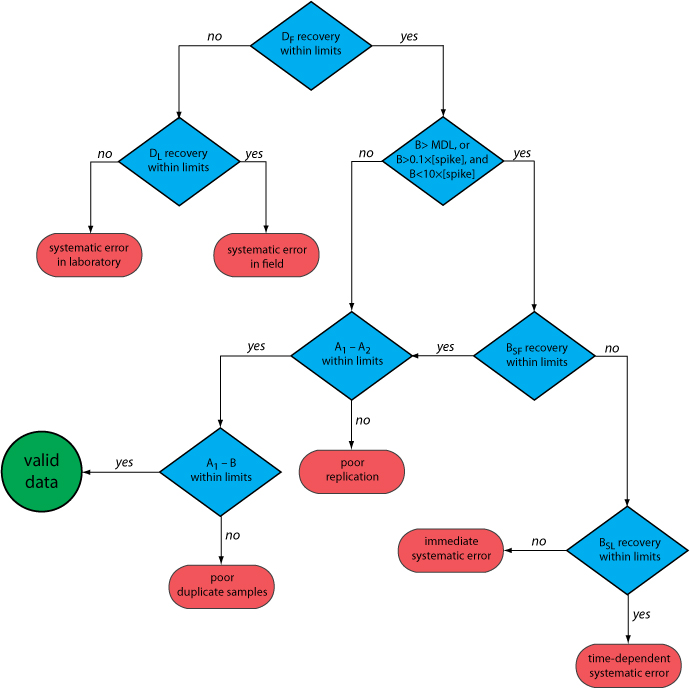
Illustrated here is an example of a prescriptive approach to quality assurance for laboratories monitoring waters and wastewaters, adapted from Environmental Monitoring and Support Laboratory, U. S. Environmental Protection Agency, “Handbook for Analytical […]
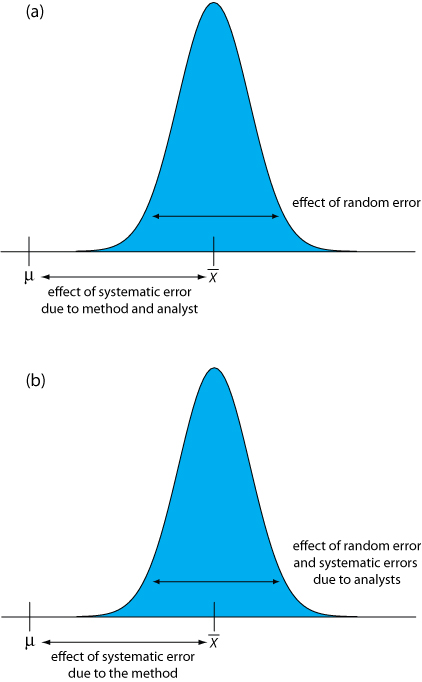
When an analyst performs a single analysis on a sample the difference between the experimentally determined value and the expected value is influenced by three sources of error: random errors, systematic errors […]
In many cases the underlying theoretical relationship between the response and its factors is unknown. We can still develop a model of the response surface if we make some reasonable assumptions about […]
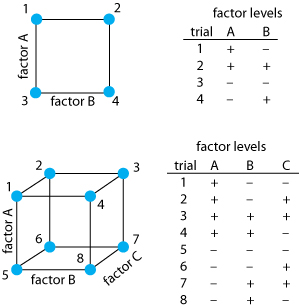
One strategy for improving the efficiency of a searching algorithm is to change more than one factor at a time. A convenient way to accomplish this when there are two factors is […]
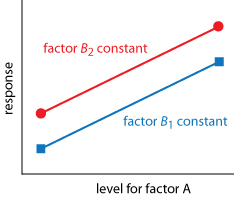
A simple algorithm for optimizing the response for a system is to adjust independently each factor. Consider a response that depends on two factors. We begin by optimizing the response for one […]
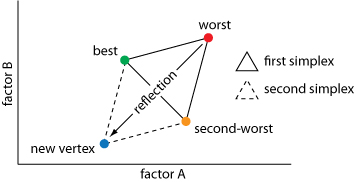
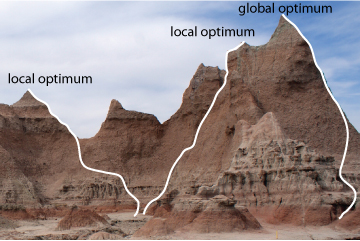
If we know the equation for a response surface, then it is relatively easy to find the optimum response. Unfortunately, we rarely know any useful details about the response surface. Instead, we […]
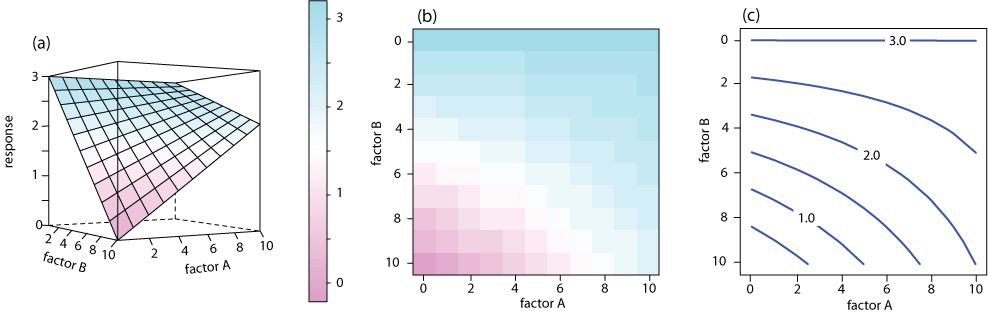
One of the most effective ways to think about an optimization is to visualize how a system’s response changes when we increase or decrease the levels of one or more of its […]
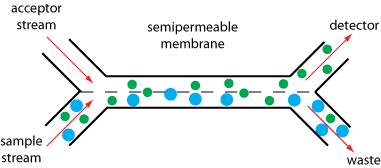
Dialysis and gaseous diffusion are accomplished by placing a semipermeable membrane between the carrier stream containing the sample and an acceptor stream. Shown here is a flow injection manifold incorporating a semipermeable membrane. […]
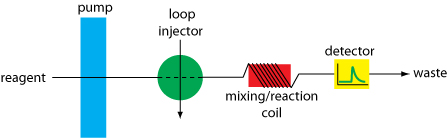
The heart of a flow injection analyzer is the transport system that brings together the carrier stream, the sample, and any reagents that react with the sample. Each reagent stream is considered […]
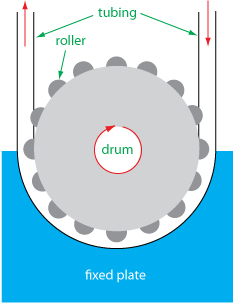
A propelling unit moves the carrier stream through the flow injection analyzer. Although several different propelling units have been used, the most common is a peristaltic pump. As illustrated here, a peristaltic […]
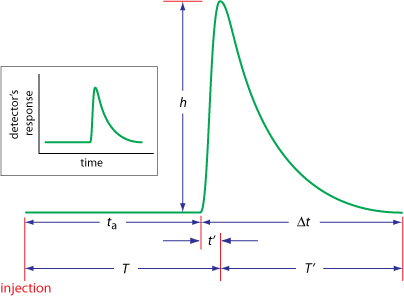
An FIA curve, or fiagram, is a plot of the detector’s signal as a function of time. The illustration below shows a typical fiagram for conditions in which both convection and diffusion […]