Limitation to Beer’s Law
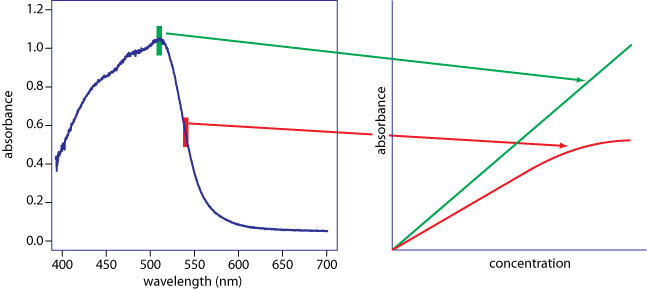
Beer’s law suggests that a calibration curve is a straight line with a y-intercept of zero and a slope of εb. In many cases a calibration curve deviates from this ideal behavior, as […]

Get a look at images, photos, videos, and animations that encompass many facets of teaching and learning about analytical chemistry.
Beer’s law suggests that a calibration curve is a straight line with a y-intercept of zero and a slope of εb. In many cases a calibration curve deviates from this ideal behavior, as […]
The illustration below shows one method for making a standard addition. The volumetric flask on the left contains a portion of the sample, Vo, and the volumetric flask on the right contains […]
Shown at the top is a reagent blank (far left) and a set of five external standards for Cu2+ with concentrations increasing from left to right. Shown below the external standards is […]
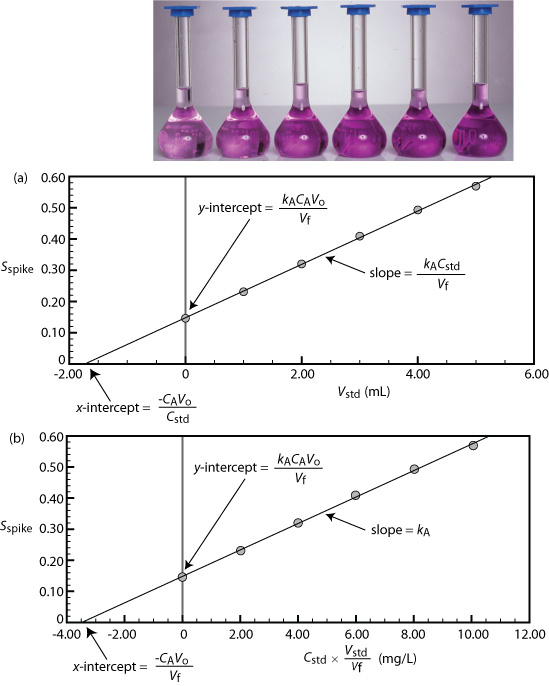
Shown at the top is a set of six standard additions for the determination of Mn2+. The flask on the left is a 25.00-mL sample diluted to 50.00 mL. The remaining flasks […]