
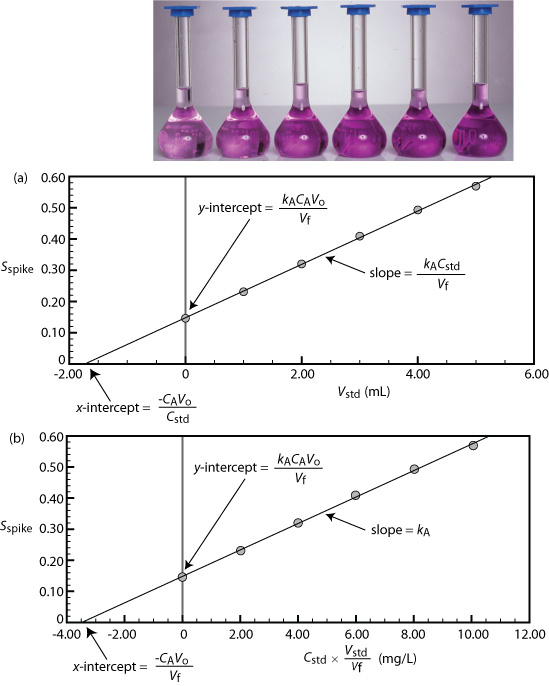
Shown at the top is a set of six standard additions for the determination of Mn2+. The flask on the left is a 25.00-mL sample diluted to 50.00 mL. The remaining flasks contain 25.00 mL of sample and, from left to right, 1.00, 2.00, 3.00, 4.00, and 5.00 mL of an external standard of 100.6 mg/L Mn2+. Shown below are two ways to plot a standard additions calibration curve. The absorbance for each standard addition, Sspike, is shown by the filled circles.
Standard Addition Calibration Curve


About the Author

David Harvey
David T. Harvey is a Professor Emeritus of Chemistry and Biochemistry at DePauw University in Greencastle, Indiana, where he has been a dedicated faculty member since 1986. Over his nearly four-decade career, Dr…
View contributions