Evaluating a Linear Regression Model
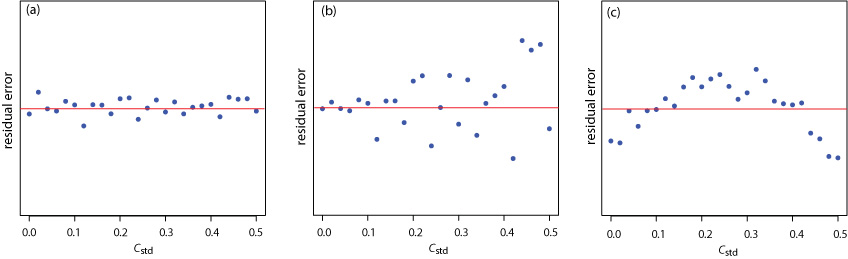
The three plots below show the residual error in the signal, Sstd, as a function of the concentration of analyte, Cstd for an unweighted straight-line regression model. The red line in each […]

Get a look at images, photos, videos, and animations that encompass many facets of teaching and learning about analytical chemistry.
The three plots below show the residual error in the signal, Sstd, as a function of the concentration of analyte, Cstd for an unweighted straight-line regression model. The red line in each […]
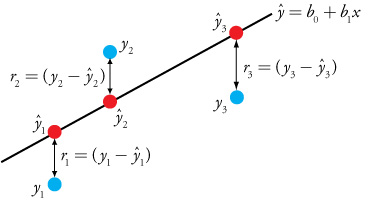
The figure here illustrates the basis of a linear regression analysis. The points in blue are the experimental data and the points in red are the predicted values from the regression equation. […]