
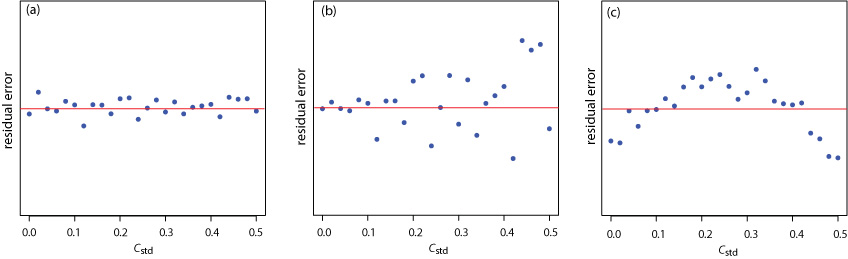
The three plots below show the residual error in the signal, Sstd, as a function of the concentration of analyte, Cstd for an unweighted straight-line regression model. The red line in each plot shows a residual error of zero. The distribution of the residual error in (a) suggests that the unweighted linear regression model is appropriate as there is no pattern to the distribution of the residual errors. The increase in the spread of the residual errors in (b) at higher concentrations of analyte suggests that a weighted straight-line regression is more appropriate. For (c), the curved pattern to the residuals suggests that a straight-line model is inappropriate; linear regression using a quadratic model might produce a better fit.

