Fiagrams
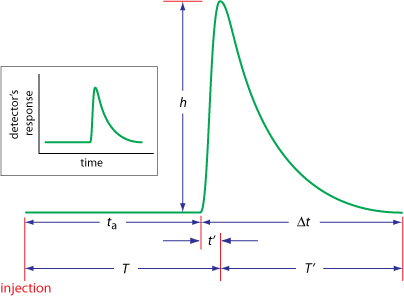
An FIA curve, or fiagram, is a plot of the detector’s signal as a function of time. The illustration below shows a typical fiagram for conditions in which both convection and diffusion […]

Get a look at images, photos, videos, and animations that encompass many facets of teaching and learning about analytical chemistry.
An FIA curve, or fiagram, is a plot of the detector’s signal as a function of time. The illustration below shows a typical fiagram for conditions in which both convection and diffusion […]
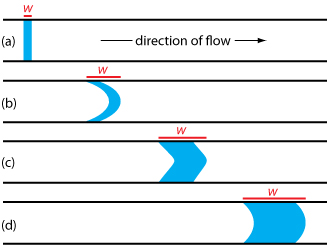
When we first inject a sample into an FIA’s carrier stream it has the rectangular flow profile of width w as shown below in (a). As the sample moves through the mixing […]
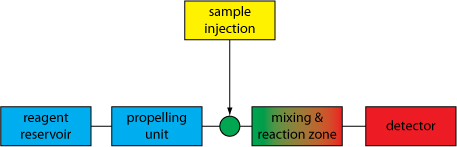
Flow injection analysis (FIA) was developed in the mid-1970s as a highly efficient technique for the automated analyses of samples. Unlike a centrifugal analyzer, in which the number of samples is limited […]
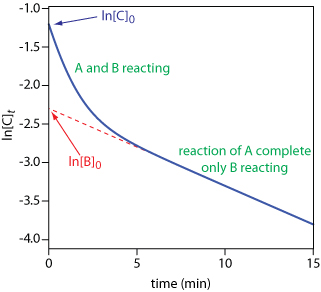
The figure below illustrates how we can use a kinetic analysis to determine the concentration of two analytes, A and B, provided that there is a difference in their reaction rates. In […]
When an inhibitor interacts with an enzyme it decreases the enzyme’s catalytic efficiency. An irreversible inhibitor covalently binds to the enzyme’s active site, producing a permanent loss in catalytic efficiency even if […]
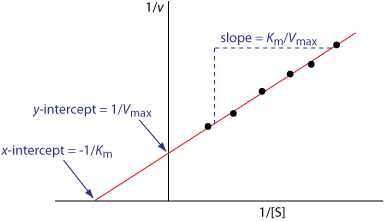
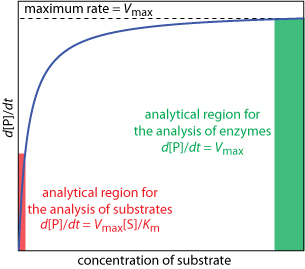
For an enzyme–substrate reaction following a simple mechanism E + S ↔ E–S ↔ E + P consisting of the initial formation of an enzyme–substrate complex, ES, and its subsequent decomposition to form the product, […]
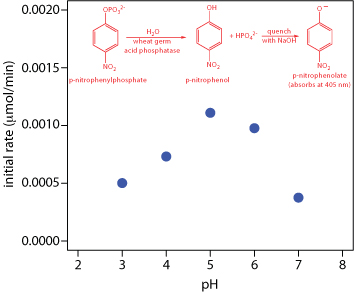
Enzymes are highly specific catalysts for biochemical reactions, with each enzyme showing a selectivity for a single reactant, or substrate. For example, the enzyme acetylcholinesterase catalyzes the decomposition of the neurotransmitter acetylcholine […]
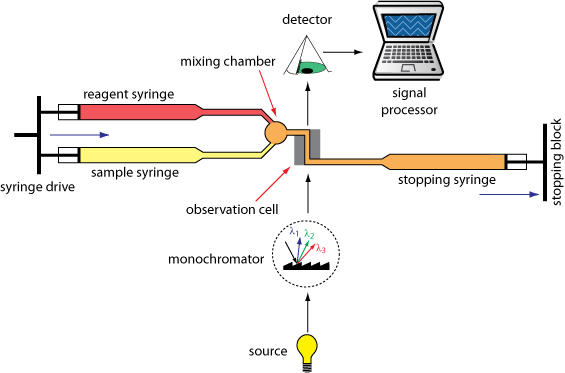
A significant experimental problem when the reaction’s kinetics are fast is ensuring that we rapidly and reproducibly mix the sample and the reagents. For a fast reaction we need to make measurements […]
Monitoring a kinetic reaction is straight-forward, provided that the reaction does not proceed to a appreciable extent during the time it takes to make an individual measurement. As you might expect, this […]
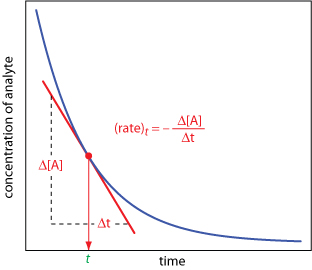
In a rate method we use the differential form of the rate law to determine the analyte’s concentration. As shown here, the rate of a reaction at time t, (rate)t, is the […]
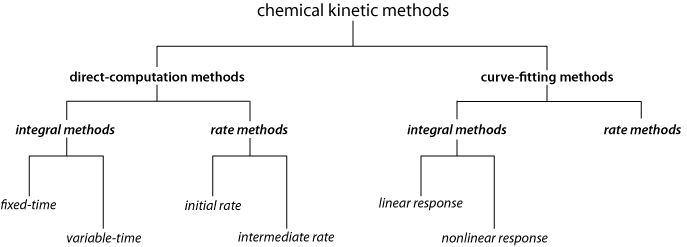
Shown here is one useful scheme for classifying chemical kinetic methods of analysis. Methods are divided into two main categories: direct-computation methods and curve-fitting methods. In a direct-computation method we calculate the […]
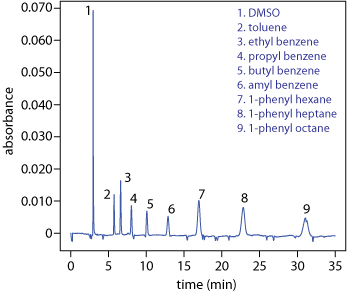
Another approach to separating neutral species is capillary electrochromatography, CEC. In CEC the capillary tubing is packed with 1.5–3 μm particles coated with a bonded stationary phase. Neutral species separate based on […]