Drawing an Acid-Base Titration Curve
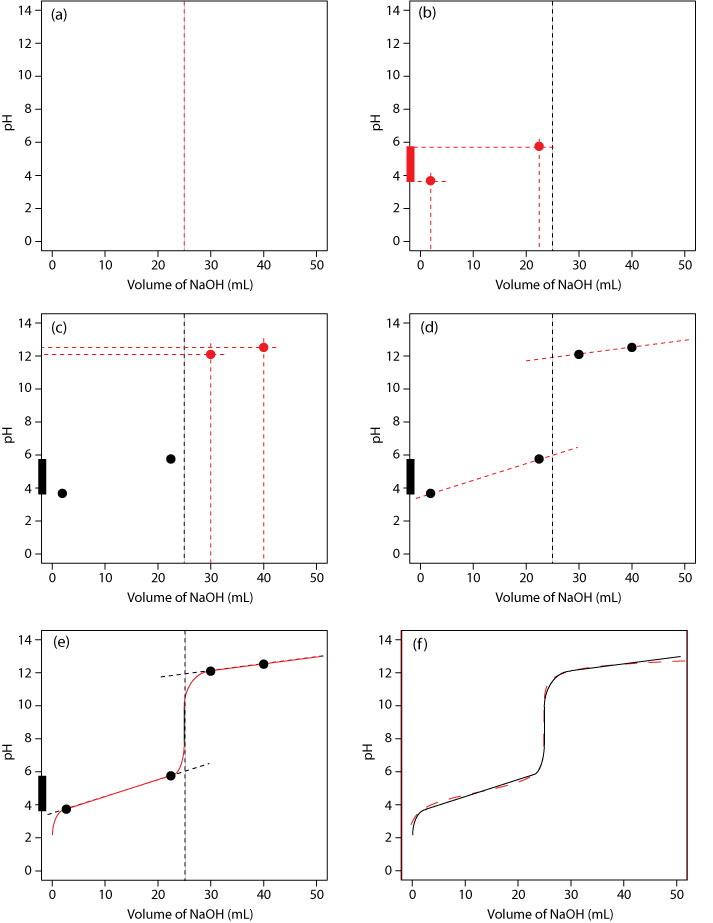
This set of illustrations shows the steps for quickly sketching an good approximation of the titration curve for the titration of 50.0 mL of 0.100 M CH3COOH with 0.200 M NaOH: (a) […]

Get a look at images, photos, videos, and animations that encompass many facets of teaching and learning about analytical chemistry.
This set of illustrations shows the steps for quickly sketching an good approximation of the titration curve for the titration of 50.0 mL of 0.100 M CH3COOH with 0.200 M NaOH: (a) […]
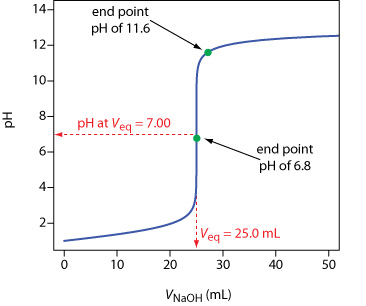
Typical acid–base titration curve showing how the titrand’s pH changes with the addition of titrant. The titrand is a 25.0 mL solution of 0.100 M HCl and the titrant is 0.100 M […]