
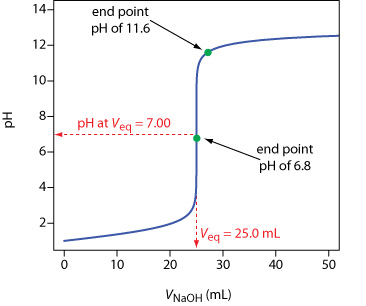
Typical acid–base titration curve showing how the titrand’s pH changes with the addition of titrant. The titrand is a 25.0 mL solution of 0.100 M HCl and the titrant is 0.100 M NaOH. The titration curve is the solid blue line, and the equivalence point volume (25.0 mL) and pH (7.00) are shown by the dashed red lines. When using an indicator to signal the titration’s end point, we stop the titration at the pH where the indicator changes color. The green dots show two possible end points. The volume of titrant to reach the end point at a pH of 6.8 is very close to the equivalence point, evincing a small titration error; titrating to the end point at a pH of 11.6, however, produces a larger titration error.
Strong Acid–Strong Base Titration Curve


About the Author

David Harvey
David T. Harvey is a Professor Emeritus of Chemistry and Biochemistry at DePauw University in Greencastle, Indiana, where he has been a dedicated faculty member since 1986. Over his nearly four-decade career, Dr…
View contributions