
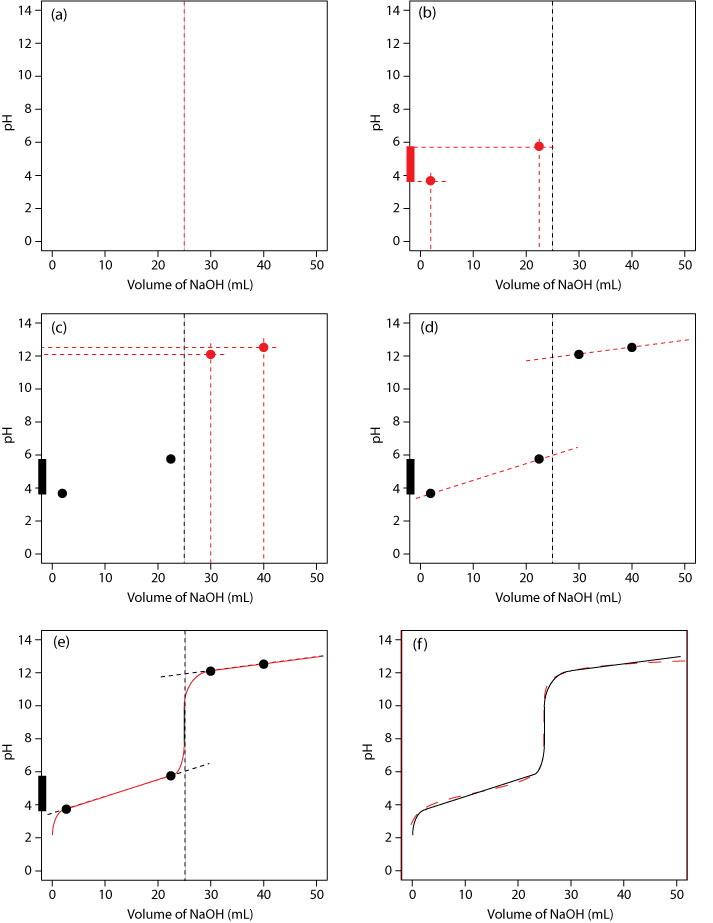
This set of illustrations shows the steps for quickly sketching an good approximation of the titration curve for the titration of 50.0 mL of 0.100 M CH3COOH with 0.200 M NaOH:
- (a) determine the equivalence point volume—in this case 25 mL—and add a vertical line on a graph showing pH on the y-axis and volume of titrant on the x-axis
- (b) before the equivalence point, the reaction mixture is a buffer; the pH at 10% of the equivalence point volume is equivalent to approximately pKa – 1, where pKa is that for the titrand, and the pH at 90% of the equivalence point volume is equivalent to approximately pKa + 1; add these two points
- (c) calculate the solution’s pH for two volumes of titrant exceeding the equivalence point volume; here the pH is controlled by the concentration of excess titrant
- (d) draw straight-lines through the set of two points before and the set of two points after the equivalence point; these lines, along with the vertical line at the equivalence point show the general shape of the titration curve
- (e) complete your sketch by drawing a smooth curve along the three straight-line segments
The illustration in (f) shows comparison of the approximate titration curve (solid black line) and exact titration curve (dashed red line).

