Dixon’s Q-Test
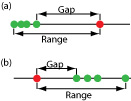
A data point that is not consistent with the remaining data is called an outlier. Consider, for example, an experiment in which we determine the mass for each penny in a sample […]

Get a look at images, photos, videos, and animations that encompass many facets of teaching and learning about analytical chemistry.
A data point that is not consistent with the remaining data is called an outlier. Consider, for example, an experiment in which we determine the mass for each penny in a sample […]
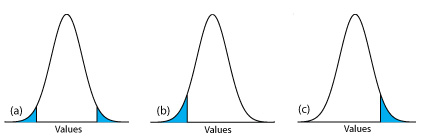
The figure below shows the relationship between confidence intervals and the result of a t-test. (a) The shaded area under the normal distribution curve shows the confidence interval for the sample based […]
Example showing (a) a two-tailed, and (b and c) a one-tailed, significance test of an sample’s experimental mean relative to the population’s true mean. The normal distribution curves are drawn using the sample’s […]