
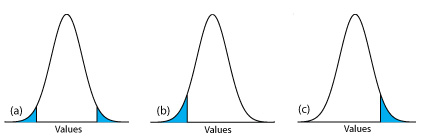
Example showing (a) a two-tailed, and (b and c) a one-tailed, significance test of an sample’s experimental mean relative to the population’s true mean. The normal distribution curves are drawn using the sample’s mean and standard deviation. For α = 0.05, the blue areas account for 5% of the area under the curve. If the value of μ falls within the blue areas, then we reject the null hypothesis that there is no difference between the sample’s mean and the population’s mean. For a two-tailed test we accept the alternative hypothesis that the sample’s mean is significantly different from that for the population, but do not conclude that it is smaller or larger. For a one-tailed test we accept the alternative hypothesis that the sample’s mean is significantly different from that for the population, and also conclude that it is smaller or larger. We retain the null hypothesis that there is no difference between the sample’s mean and the population’s mean if the value of μ is within the unshaded area of the curve.


