
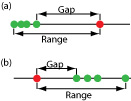
A data point that is not consistent with the remaining data is called an outlier. Consider, for example, an experiment in which we determine the mass for each penny in a sample of pennies; we might encounter an outlier for several reasons: the outlier might be from a different population (Is this a Canadian penny?); the outlier might be a contaminated or otherwise altered sample (Is the penny damaged?); or the outlier may result from an error in the analysis (Did we forget to tare the balance?). Regardless of its source, the presence of an outlier compromises any meaningful analysis of our data.
One of the most common significance tests for outliers is Dixon’s Q‑test. The null hypothesis is that there are no outliers, and the alternative hypothesis is that there is an outlier. The Q-test compares the gap between the suspected outlier and its nearest numerical neighbor to the range of the entire data set, where the gap and range are defined as shown here.

The test statistic, Qexp, is the defined as the absolute value of the ratio of the gap to range. When Qexp exceeds a critical value, we remove the suspect value from our data set.
You should exercise caution when using a significance test for outliers because there is a chance you will reject a valid result. In addition, you should avoid rejecting an outlier if it leads to a precision that is unreasonably better than that expected based on a propagation of uncertainty. Given these two concerns it is not surprising that some statisticians caution against the removal of outliers.

