Selecting an Indicator for a Redox Titration
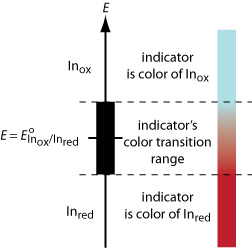
The most important class of indicators for redox titrations are substances that do not participate in the redox titration, but whose oxidized and reduced forms differ in color. When we add a […]

Get a look at images, photos, videos, and animations that encompass many facets of teaching and learning about analytical chemistry.
The most important class of indicators for redox titrations are substances that do not participate in the redox titration, but whose oxidized and reduced forms differ in color. When we add a […]
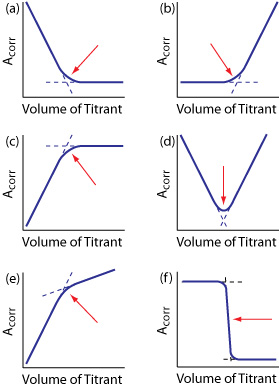
If at least one species in a complexation titration absorbs electromagnetic radiation, we can identify the end point by monitoring the titrand’s absorbance at a carefully selected wavelength. For example, we can […]
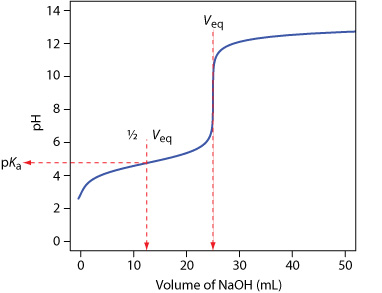
Another application of acid–base titrimetry is the determination of equilibrium constants. Consider, for example, a solution of acetic acid, CH3COOH, for which the dissociation constant is Ka = [H3O+][CH3COO–]/[CH3COOH] When the concentrations […]
An alternative to using a visual indicator to locate a titration’s end point is to continuously monitor the titration’s progress using a sensor whose signal is a function of the analyte’s concentration. […]
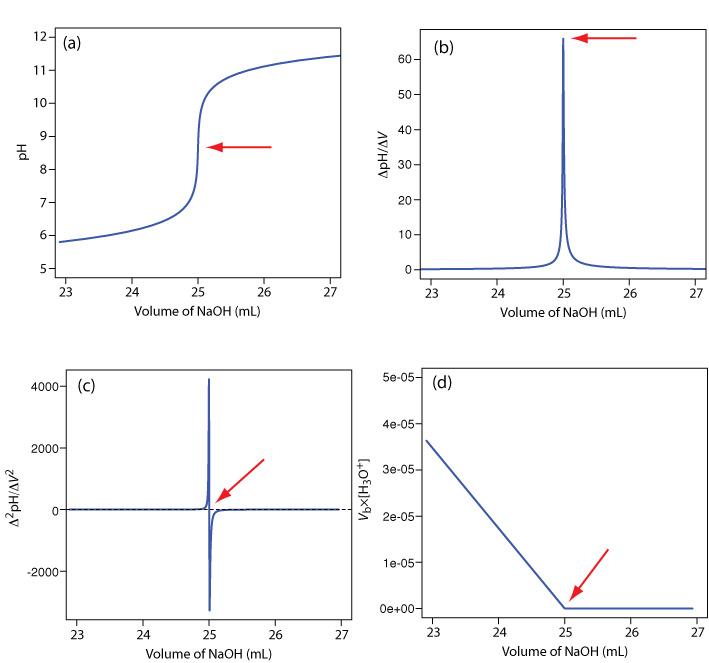
For most acid–base titrations the inflection point, the point on a titration curve having the greatest slope, very nearly coincides with the equivalence point. The red arrows in the following figure for […]
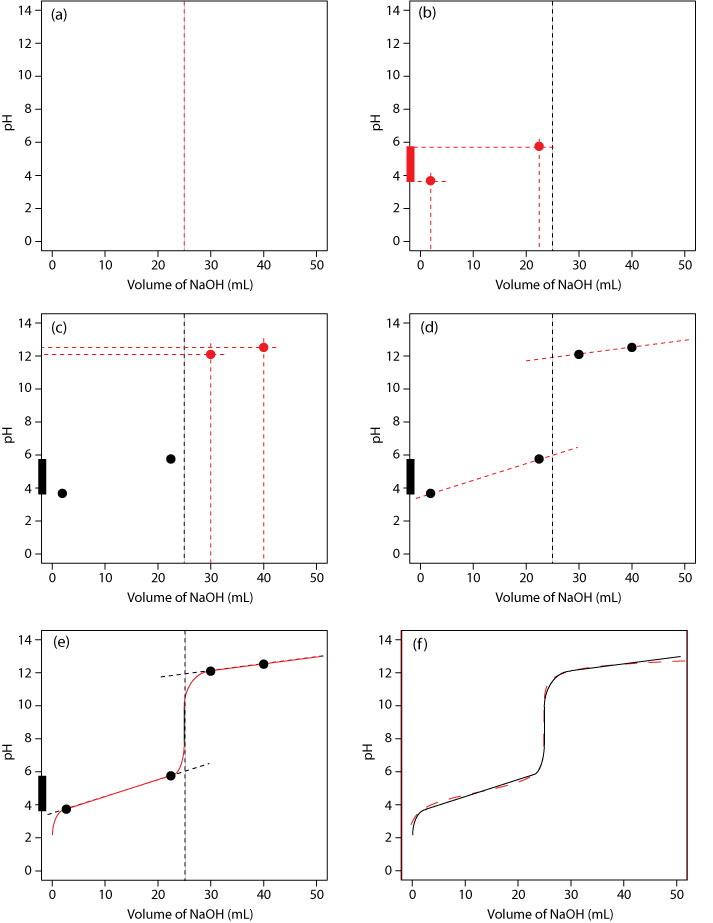
This set of illustrations shows the steps for quickly sketching an good approximation of the titration curve for the titration of 50.0 mL of 0.100 M CH3COOH with 0.200 M NaOH: (a) […]
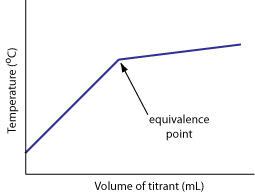
An acid-base reaction is exothermic, which means we can follow the titration by monitoring the titration mixture’s temperature as a function of the volume of titrant added. A typical thermometric titration curve […]
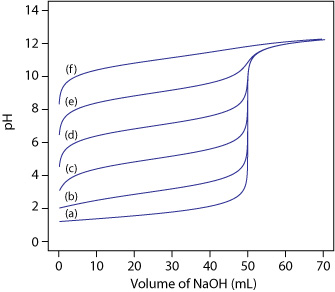
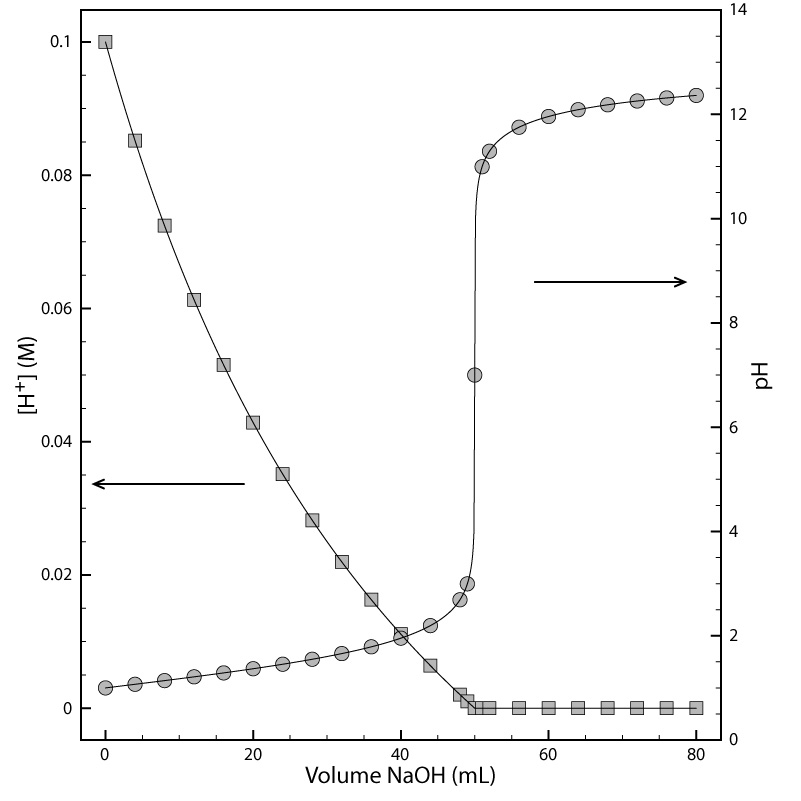
When the concentration of a species spans many orders of magnitude, it is difficulty to display how that species’ concentration changes during a chemical reaction. Such is the case here for the […]