
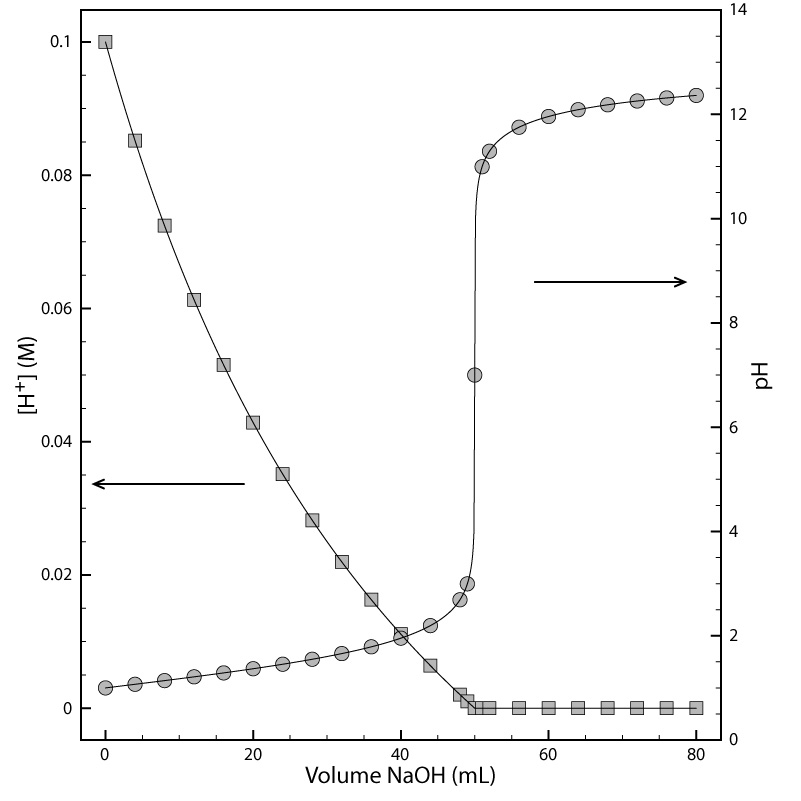
When the concentration of a species spans many orders of magnitude, it is difficulty to display how that species’ concentration changes during a chemical reaction. Such is the case here for the titration of HCl with NaOH. The y-axis on the left-side of the figure displays the [H+] as a function of the volume of NaOH. The initial [H+] is 0.10 M and its concentration after adding 80 mL of NaOH is 4.3 × 10⁻¹³ M. We can easily follow the change in [H+] for the first 14 additions of NaOH. For the remaining additions of NaOH, however, the change in [H+] is too small to see.

Converting the [H+] to a pH value, where
pH = –log[H+]
allows us to follow the change in the concentration of H+ throughout the course of the reaction. We call the function –logX a p-function where
pX = –logX

