Atomizer for Flame Atomic Absorption Spectroscopy
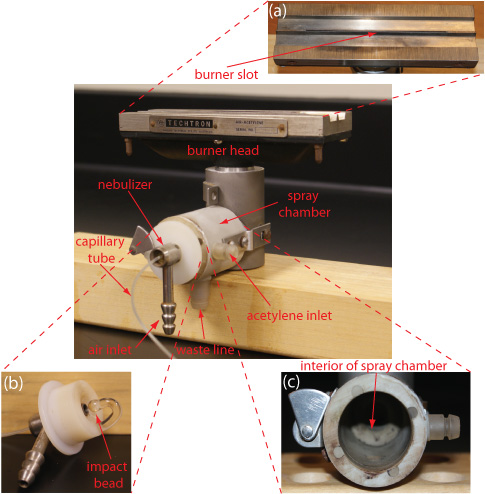
The photos below shows a typical assembly for flame atomization with close-up views of several key components. In the unit shown here, the sample is drawn into the assembly by passing a […]

Get a look at images, photos, videos, and animations that encompass many facets of teaching and learning about analytical chemistry.
The photos below shows a typical assembly for flame atomization with close-up views of several key components. In the unit shown here, the sample is drawn into the assembly by passing a […]
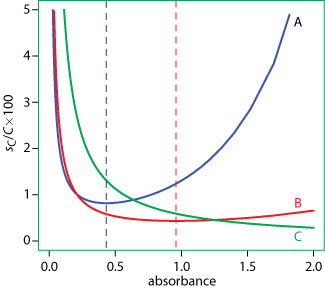
As shown here, the relative uncertainty in determining absorbance (and thus in determining concentration) is greater at very high and very low absorbances (that is, when very little or almost all of […]
In absorption spectroscopy, precision is limited by indeterminate errors—primarily instrumental noise—introduced when measuring absorbance. Precision is generally worse for low absorbances where P0≈ PT, and for high absorbances when PT approaches 0. […]
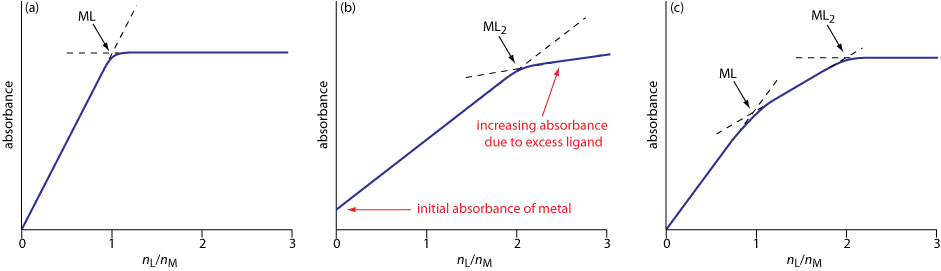
An alternative to the method of continuous variations for determining the stoichiometry of metal-ligand complexes is the mole-ratio method in which the amount of one reactant, usually the moles of metal, is held […]
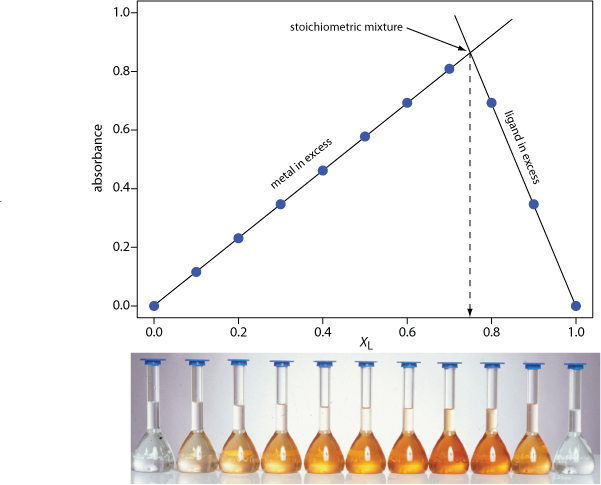
The method of continuous variations, also called Job’s method, is used to determine the stoichiometry of a metal-ligand complex. In this method we prepare a series of solutions such that the total […]
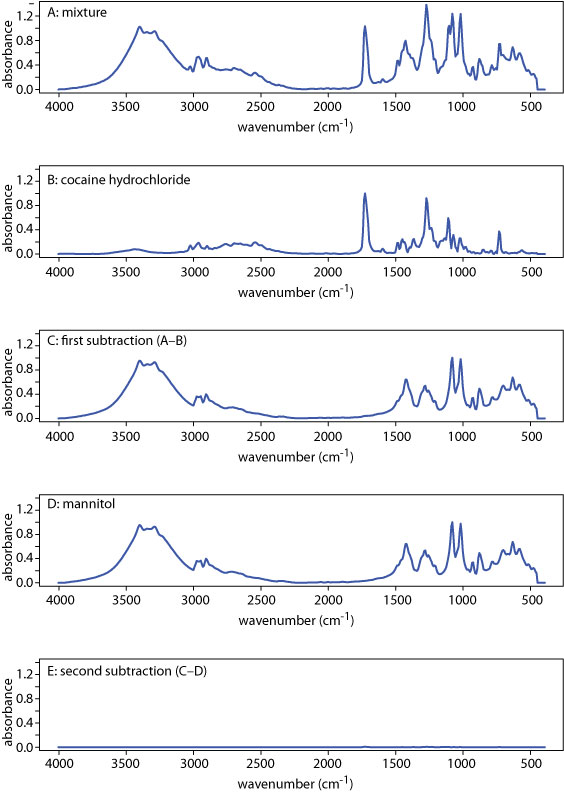
With the availability of computerized data acquisition and storage it is possible to build digital libraries of standard reference spectra. The identity of an a unknown compound can often be determined by […]
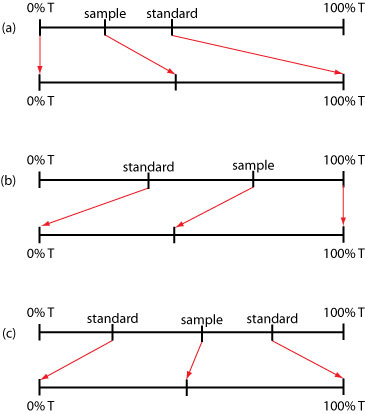
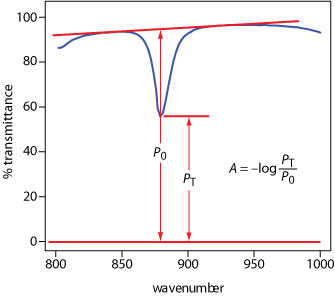
A quantitative analysis based on the absorption of infrared radiation, although important, is less frequently encountered than those for UV/Vis absorption. One reason is the difficulty in establishing a 100% T (A […]
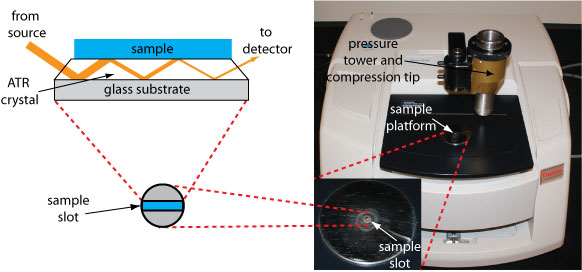
The illustration below shows an FT-IR spectrometer equipped with a diamond ATR sample cell. The inserts show a close-up photo of the sample platform, a sketch of the ATR’s sample slot, and […]
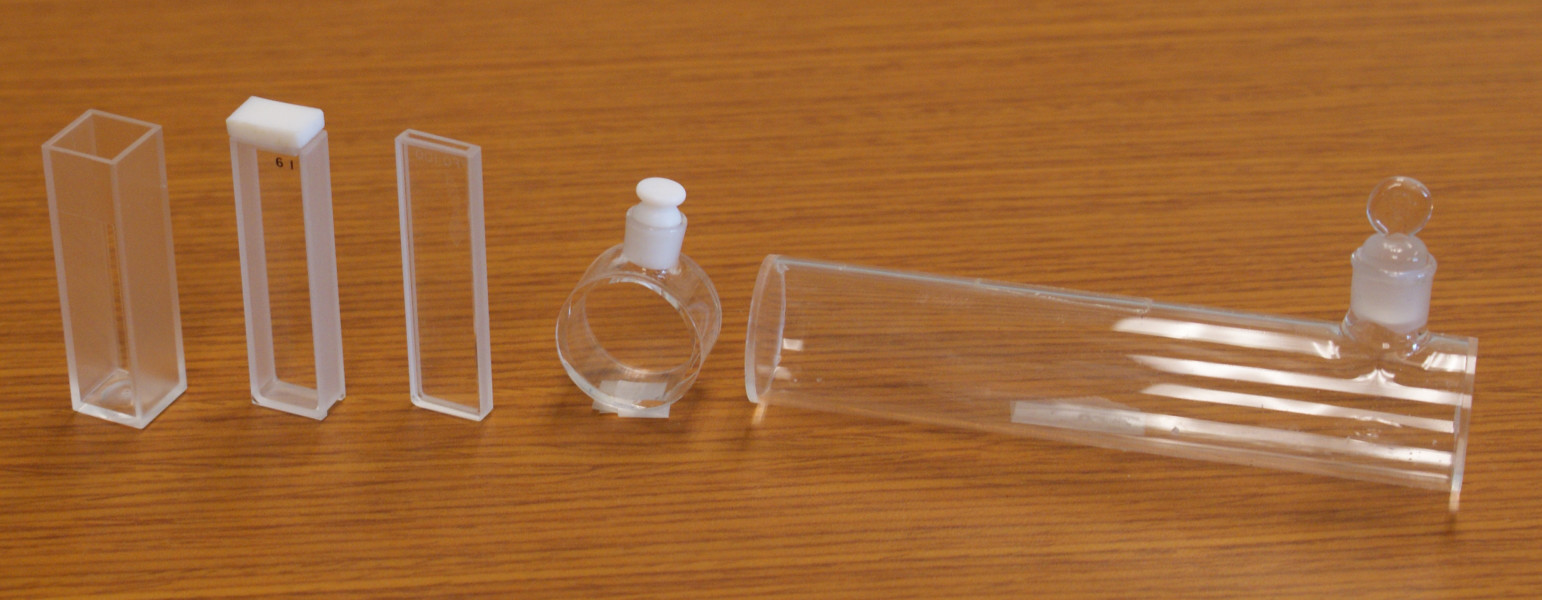
The photo below shows several examples of sample cells for UV/Vis spectroscopy. From left to right (with path lengths in parentheses): rectangular plastic cuvette (10.0 mm), rectangular quartz cuvette (5.000 mm), rectangular […]
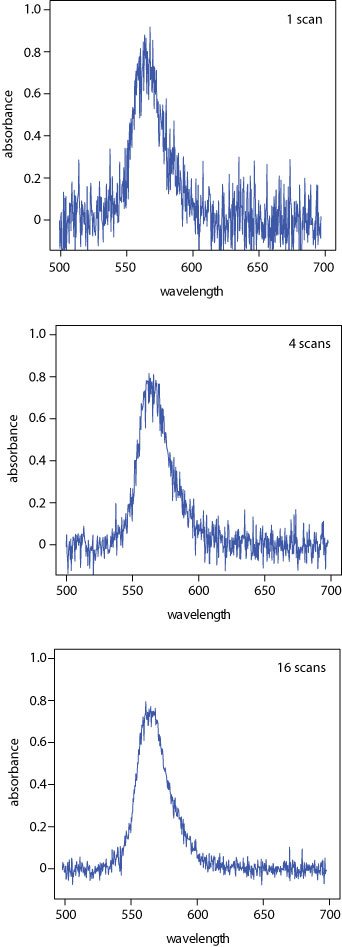
Examples showing the effect of signal averaging on a spectrum’s signal-to-noise ratio. From top to bottom: spectrum for a single scan; average spectrum after four scans; and average spectrum after adding 16 […]
Several of the posts in the Analytical Image and Video Exchange include schematic diagrams of spectrophotometers. Gathered here are jpeg files for the various components used to create these schematic diagrams. source […]
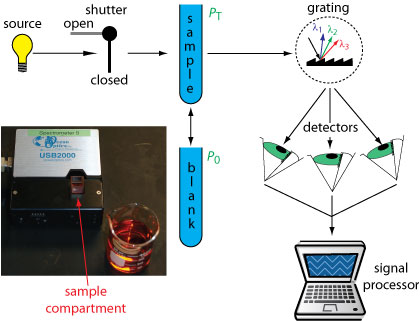
The illustration here shows a schematic diagram of a diode array spectrophotometer, in which we replace a single photomultiplier detector with an array of photodiodes. The source radiation passes through the sample and is […]