Certificate of Analysis
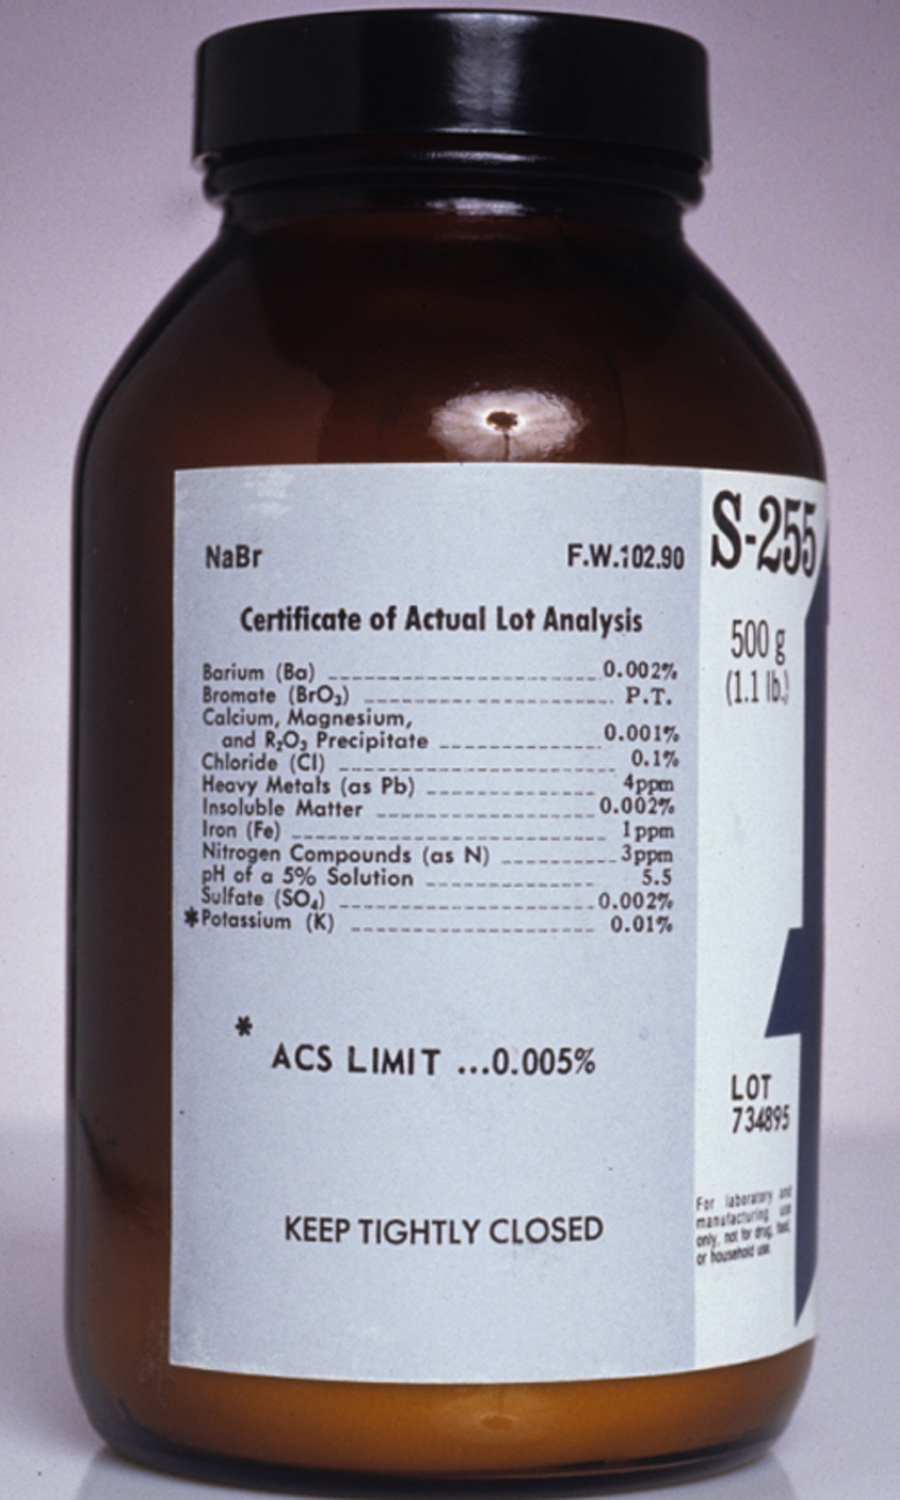
When a manufacturer lists a chemical as ACS Reagent Grade, they must demonstrate that it conforms to specifications set by the American Chemical Society (ACS). For example, the ACS specifications for NaBr […]

Get a look at images, photos, videos, and animations that encompass many facets of teaching and learning about analytical chemistry.
When a manufacturer lists a chemical as ACS Reagent Grade, they must demonstrate that it conforms to specifications set by the American Chemical Society (ACS). For example, the ACS specifications for NaBr […]
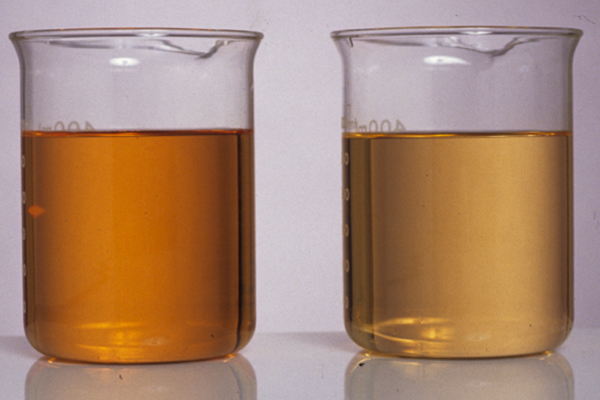
The effect of a inert salt on a reaction’s equilibrium position is shown by the solutions in these two beakers. The beaker on the left contains equal volumes of 1.0 mM FeCl3 […]
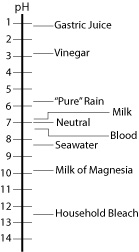
Scale showing the pH value for representative solutions. Milk of Magnesia is a saturated solution of Mg(OH)2.
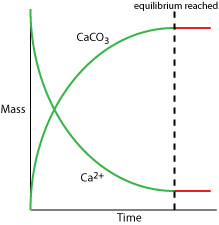
The figure below shows how the masses of Ca2+ and CaCO3 change as a function of time during the precipitation of CaCO3. The dashed line indicates when the reaction reaches equilibrium. Prior […]
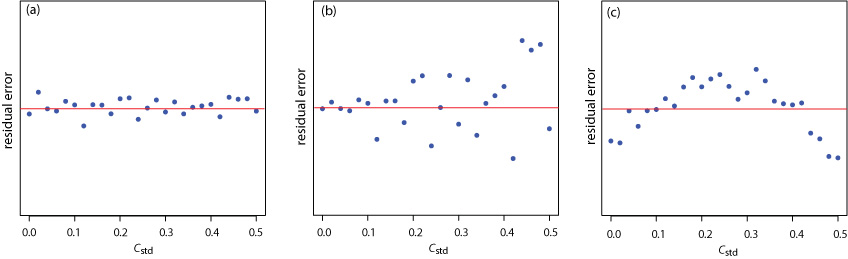
The three plots below show the residual error in the signal, Sstd, as a function of the concentration of analyte, Cstd for an unweighted straight-line regression model. The red line in each […]
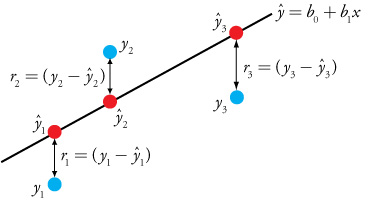
The figure here illustrates the basis of a linear regression analysis. The points in blue are the experimental data and the points in red are the predicted values from the regression equation. […]
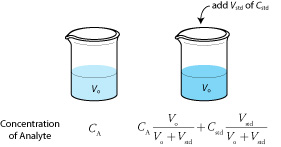
One approach for preparing standard additions is to spike equal volumes of the sample with different volumes of a standard and diluting each to the same final volume. An alternative form of […]
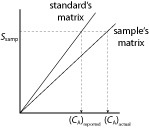
Sometimes the solution matrix in which the analyte resides affects the relationship between the signal and the analyte’s concentration, as shown below. We call this a matrix effect. When matrix effects are […]
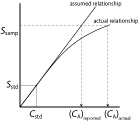
When using a single-point standardization, we must assume that there is a linear relationship between the signal and the analyte’s concentration. When this is not true, which often is the case at […]
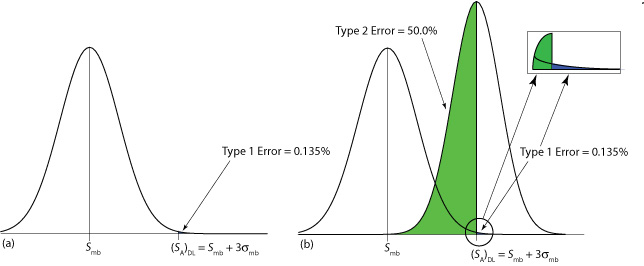
The figure below shows the probability of type 1 and type 2 errors for the IUPAC detection limit. (a) The normal distribution curve for the method blank, with a signal for the […]
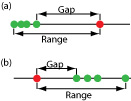
A data point that is not consistent with the remaining data is called an outlier. Consider, for example, an experiment in which we determine the mass for each penny in a sample […]
The figure below shows the relationship between confidence intervals and the result of a t-test. (a) The shaded area under the normal distribution curve shows the confidence interval for the sample based […]