Schematic Diagram of a Galvanostat
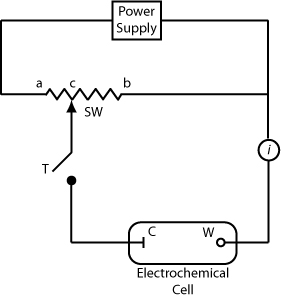
A galvanostat is used to control the current flowing through an electrochemical cell. A schematic diagram of a constant-current galvanostat is shown here where A is the auxiliary electrode, W is the working […]

A galvanostat is used to control the current flowing through an electrochemical cell. A schematic diagram of a constant-current galvanostat is shown here where A is the auxiliary electrode, W is the working […]
To measure the potential of an electrochemical cell under a condition of zero current we use a potentiometer. Shown here is a schematic diagram for a manual potentiometer, which consists of a […]
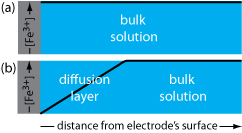
In electrochemistry, there is an important distinction between the concentration of a species at the electrode’s surface and its concentration at some distance from the electrode’s surface (in what we call the […]
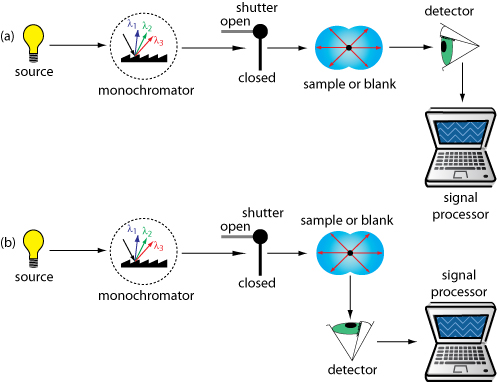
Turbidimetry and nephelometry are two techniques based on the elastic scattering of radiation by a suspension of colloidal particles: (a) in turbidimetry the detector is placed in line with the source and […]
Elastic scattering is divided into two types: Rayleigh, or small-particle scattering, and large-particle scattering. Rayleigh scattering occurs when the scattering particle’s largest dimension is less than 5% of the radiation’s wavelength. The […]
Flame emission is subject to the same types of chemical interferences as atomic absorption. These interferences are minimized by adjusting the flame’s composition and adding protecting agents, releasing agents, or ionization suppressors. […]
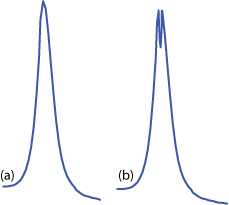
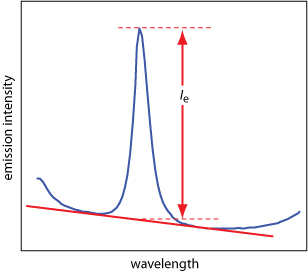
The most important spectral interference in emission spectroscopy is broad, background emission from the flame or plasma, and emission bands from molecular species. This background emission is particularly severe for flames because […]
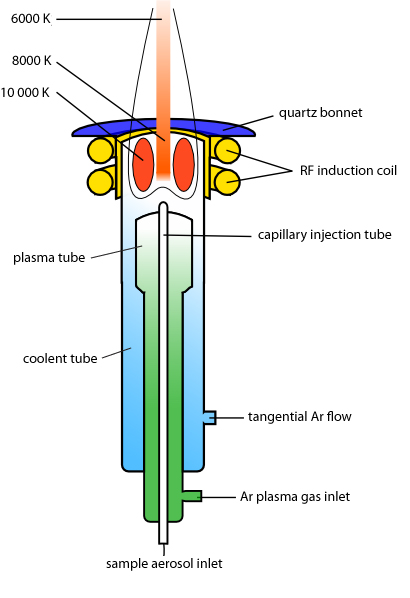
The illustration below provides a schematic diagram of an inductively coupled plasma source (ICP), which consists of three concentric quartz tubes surrounded at the top by a radio-frequency induction coil. The sample […]
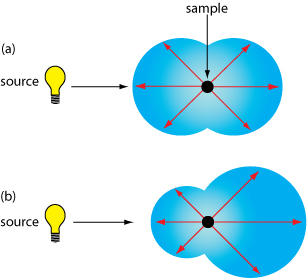
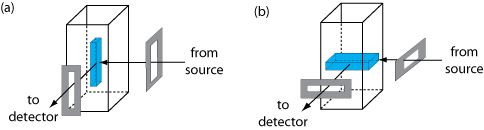
Illustration showing how slit orientation changes the volume from which fluorescence is measured: (a) vertical slit orientation; (b) horizontal slit orientation. Suppose each slit’s dimensions are 0.1 mm × 3 mm. In […]
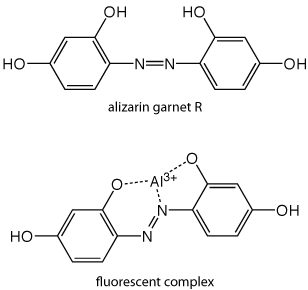
Except for a few metal ions, most notably UO2+, most inorganic ions are not sufficiently fluorescent for a direct analysis. Many metal ions may be determined indirectly by reacting with an organic […]
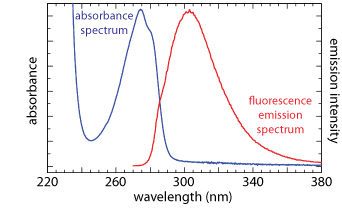
A photoluminescence spectrum is recorded by measuring emission intensity as a function of either the excitation wavelength or the emission wavelength. An excitation spectrum is obtained by monitoring emission at a fixed […]
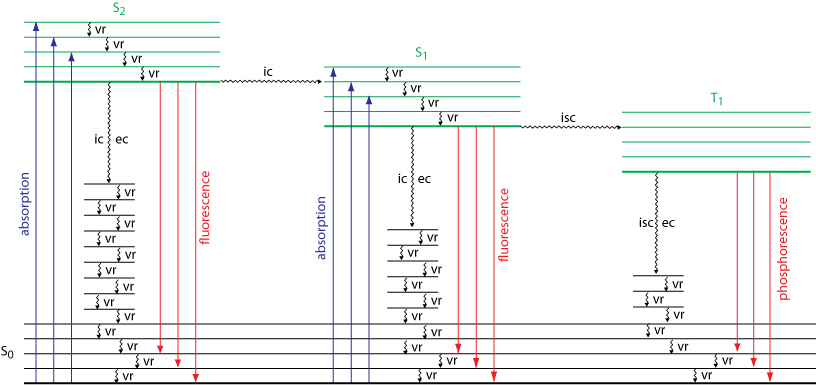
Shown here is an illustration of the energy level diagram for a molecule exhibiting pathways for the deactivation of an excited state: vr is vibrational relaxation; ic is internal conversion; ec is […]