
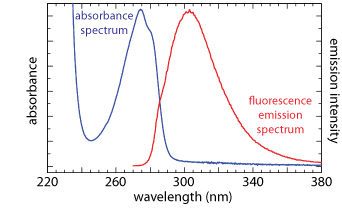
A photoluminescence spectrum is recorded by measuring emission intensity as a function of either the excitation wavelength or the emission wavelength. An excitation spectrum is obtained by monitoring emission at a fixed wavelength while varying the excitation wavelength. When corrected for variations in the source’s intensity and the detector’s response, a sample’s excitation spectrum is nearly identical to its absorbance spectrum.
In an emission spectrum a fixed wavelength is used to excite the sample and emission intensity is monitored as function of wavelength. Although a molecule has only a single excitation spectrum, it has two emission spectra, one for fluorescence and one for phosphorescence. The figure below shows the UV absorption spectrum and the UV fluorescence emission spectrum for tyrosine in a pH 7, 0.1 M phosphate buffer. The emission spectrum uses an excitation wavelength of 260 nm.

This illustration is modified from one created by Mark Samoza—the original file is located here—and released under a CC-BY-3.0 copyright via Wikimedia Commons.

