Dixon’s Q-Test
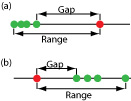
A data point that is not consistent with the remaining data is called an outlier. Consider, for example, an experiment in which we determine the mass for each penny in a sample […]

Explore resources, experiments, and teaching materials shared by the analytical sciences community.
A data point that is not consistent with the remaining data is called an outlier. Consider, for example, an experiment in which we determine the mass for each penny in a sample […]
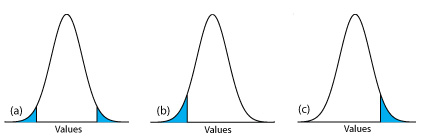
The figure below shows the relationship between confidence intervals and the result of a t-test. (a) The shaded area under the normal distribution curve shows the confidence interval for the sample based […]
Example showing (a) a two-tailed, and (b and c) a one-tailed, significance test of an sample’s experimental mean relative to the population’s true mean. The normal distribution curves are drawn using the sample’s […]
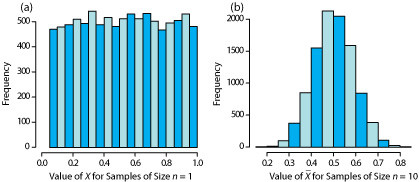
According to the central limit theorem, when an analysis is subject to a variety of indeterminate errors, the distribution of results for that analysis will approximate a normal distribution. As the number […]
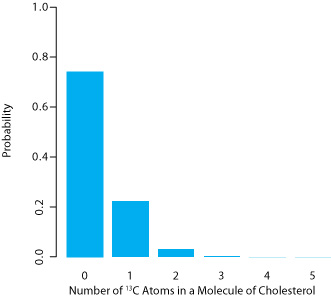
A binomial distribution describes a population whose members have only certain, discrete values. This is the case with the number of 13C atoms in cholesterol. A molecule of cholesterol, for example, can […]
A binomial distribution describes a population whose members take on only certain, discrete values. This is the case, for example, with the number of 13C atoms in cholesterol because a molecule of […]
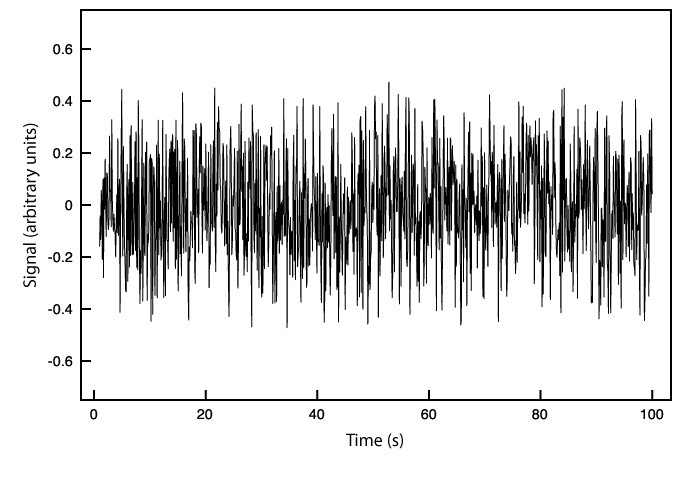
Indeterminate errors are random in nature and affect the reproducibility and repeatability of analytical measurements. We can assign indeterminate errors to several sources, including collecting samples, manipulating samples during the analysis, and making […]
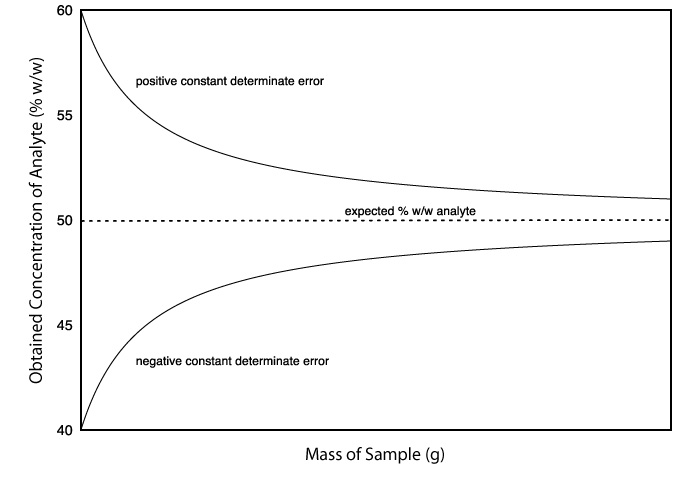
The magnitude of a constant determinate error is the same for all samples and is more significant when analyzing smaller samples. Analyzing samples of different sizes, therefore, allows us to detect a […]
Analyzing a sample generates a chemical or physical signal proportional to the amount of analyte in the sample. This signal may be anything we can measure, such as mass or absorbance. Consider […]
Choosing an analytical methods requires a consideration of three potential limitations: the amount of sample available for the analysis, the expected concentration of analyte in the samples, and the minimum amount of […]
Two determinations of the concentration of K+ in serum, showing the effect of precision on the distribution of individual results. The data in (a) are less scattered and, therefore, more precise than […]
Suppose you are asked to develop an analytical method to determine the concentration of lead in drinking water. How would you approach this problem? To provide a structure for answering this question, […]