Distillation
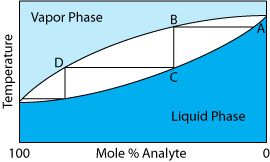
When an analyte and interferent are miscible liquids, a separation by distillation is possible if their boiling points are significantly different. The figure below shows the progress of a distillation as a […]

When an analyte and interferent are miscible liquids, a separation by distillation is possible if their boiling points are significantly different. The figure below shows the progress of a distillation as a […]
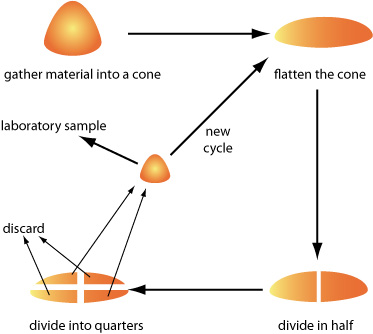
For a heterogeneous material consisting of large particulates, the original (or gross) sample may be too large to analyze. For example, a Ni-bearing ore with an average particle size of 5 mm […]
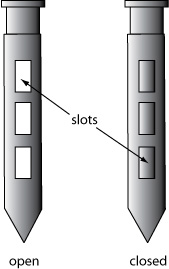
A sample thief is used for sampling smaller particulate materials, such as powders. A typical sample thief consists of two tubes that are nestled together. Each tube has one or more slots […]
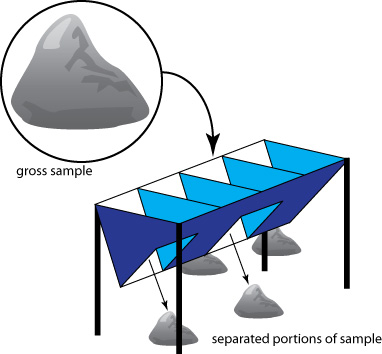
For particulate materials, particle size often determines the sampling method. Larger particulate solids, such as ores, are sampled using a riffle, which is a trough containing an even number of compartments. Because […]
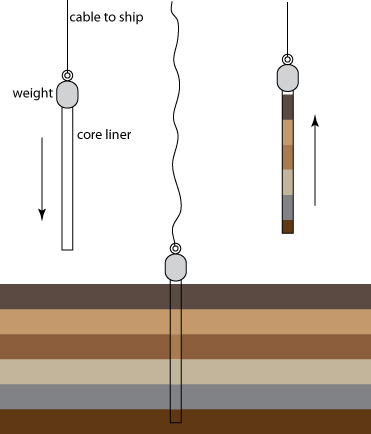
This figure shows a schematic diagram of a gravity corer in operation. The corer’s weight is sufficient to penetrate into the sediment to a depth of approximately 2 m. Flexible metal leaves […]
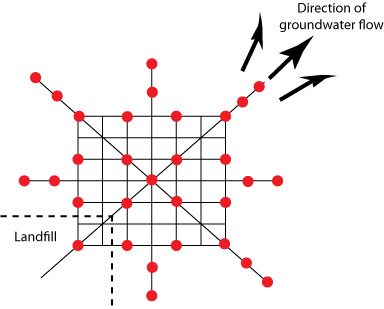
This figure shows a systematic–judgmental sampling plan for monitoring the leaching of pollutants from a landfill. The sampling sites, shown as red dots (•), are on a systematic grid that straddles the […]
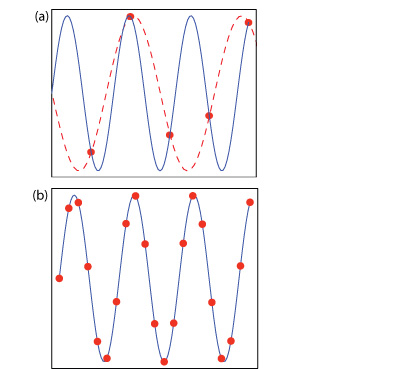
According to the Nyquist theorem, to accurately determine a periodic signal’s true frequency, we must sample the signal at least twice during each cycle or period. If we collect samples at an […]
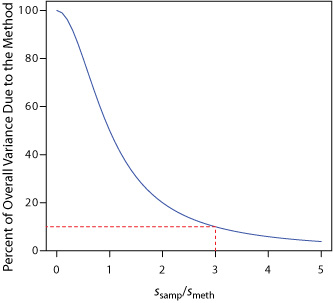
The overall variance in an analysis, s2, is the sum of the variances arising from the method, (smeth)2, and the variance due to sampling, (ssamp)2. s2 = (smeth)2 + (ssamp)2 The blue curve in […]
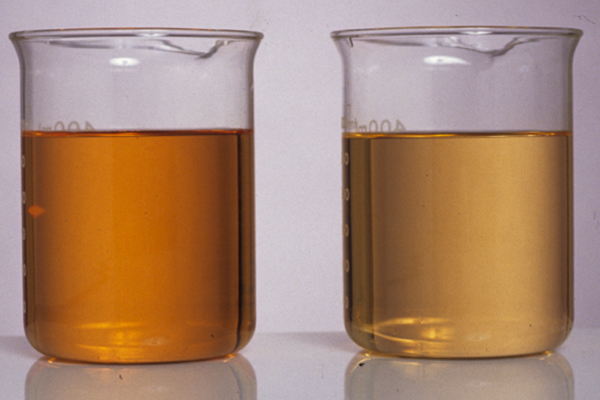
The effect of a inert salt on a reaction’s equilibrium position is shown by the solutions in these two beakers. The beaker on the left contains equal volumes of 1.0 mM FeCl3 […]
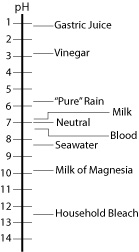
Scale showing the pH value for representative solutions. Milk of Magnesia is a saturated solution of Mg(OH)2.
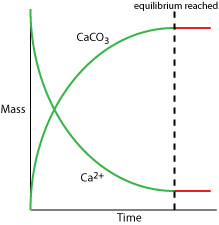
The figure below shows how the masses of Ca2+ and CaCO3 change as a function of time during the precipitation of CaCO3. The dashed line indicates when the reaction reaches equilibrium. Prior […]
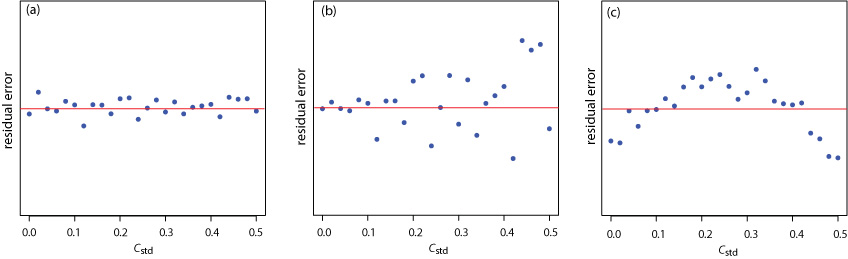
The three plots below show the residual error in the signal, Sstd, as a function of the concentration of analyte, Cstd for an unweighted straight-line regression model. The red line in each […]