
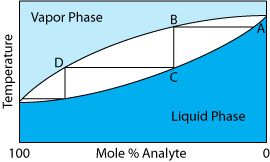
When an analyte and interferent are miscible liquids, a separation by distillation is possible if their boiling points are significantly different. The figure below shows the progress of a distillation as a plot of temperature versus the composition of the mixture’s vapor-phase and liquid-phase. The initial mixture (point A), contains more interferent than analyte. When this solution is brought to its boiling point, the vapor phase in equilibrium with the liquid phase is enriched in analyte (point B). The horizontal line connecting points A and B represents this vaporization equilibrium. Condensing the vapor phase at point B, by lowering the temperature, creates a new liquid phase whose composition is identical to that of the vapor phase (point C). The vertical line connecting points B and C represents this condensation equilibrium. The liquid phase at point C has a lower boiling point than the original mixture, and is in equilibrium with the vapor phase at point D. This process of repeated vaporization and condensation gradually separates the analyte and interferent.
Distillation


About the Author

David Harvey
David T. Harvey is a Professor Emeritus of Chemistry and Biochemistry at DePauw University in Greencastle, Indiana, where he has been a dedicated faculty member since 1986. Over his nearly four-decade career, Dr…
View contributions