
The illustration here shows two electronic energy levels (E0 and E1), each with five vibrational energy levels (ν0–ν4). Absorption of ultraviolet and visible radiation leads to a change in the analyte’s electronic energy levels and, possibly, a change in vibrational energy as well. A change in vibrational energy without a change in electronic energy, however, levels occurs with the absorption of infrared radiation.

At room temperature most molecules are in their ground vibrational state (ν = 0). A transition from the ground vibrational state to the first vibrational excited state (ν = 1) requires the absorption of a photon with an energy of hν0. Transitions in which Δν is ±1 give rise to the fundamental absorption lines. Weaker absorption lines, called overtones, result from transitions in which Δν is ±2 or ±3.
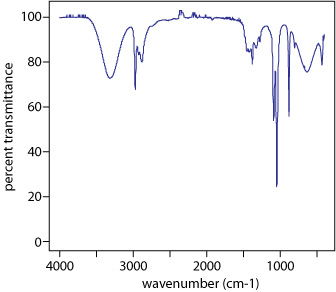
The number of possible normal vibrational modes for a linear molecule is 3N – 5, and for a non-linear molecule is 3N – 6, where N is the number of atoms in the molecule. Not surprisingly, infrared spectra often show a considerable number of absorption bands. Even a relatively simple molecule, such as ethanol (C2H6O), for example, has 3 × 9 – 6, or 21 possible normal modes of vibration, although not all of these vibrational modes give rise to an absorption. The IR spectrum for ethanol is shown here.



