
The most common method for bringing the stationary phase and the mobile phases into contact is to hold the stationary phase within a column and to pass the mobile phase through the column. The illustration below shows the progress of a column chromatographic separation of a two-component mixture. In (a) the sample is layered on top of the stationary phase. As mobile phase passes through the column, the sample separates into two solute bands (b–d). In (e) and (f), we collect each solute as it elutes from the column.

Ideally, the solute’s initial concentration profile is rectangular, as shown in (a) below. As the sample moves down the column the individual solute bands begin to broaden and develop a Gaussian profile (b and c). If the strength of each solute’s interaction with the stationary phase is sufficiently different, then the solutes separate into individual bands (d).

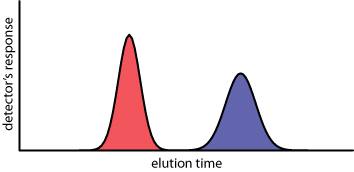
We can follow the progress of the separation either by collecting fractions as they elute from the column, or by placing a suitable detector at the end of the column. As shown here, a plot of the detector’s response as a function of elution time, or as a function of the volume of mobile phase, is known as a chromatogram, and consists of a peak for each solute.


