
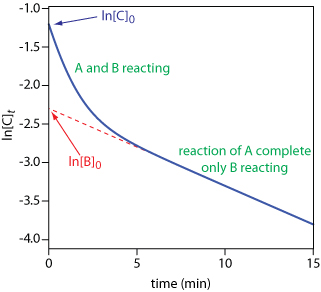
The figure below illustrates how we can use a kinetic analysis to determine the concentration of two analytes, A and B, provided that there is a difference in their reaction rates. In this example, B reacts more slowly (kB = 0.1 min–1) than A (kA = 1 min–1).

Extrapolating the linear part of the curve back to t = 0 gives ln[B]0 as –2.3, or a [B]0 of 0.10 M. At t = 0, ln[C]0 is –1.2, corresponding to a [C]0 of 0.30 M. Because [C]0 = [A]0 + [B]0, the concentration of A in the original sample is 0.20 M.

