
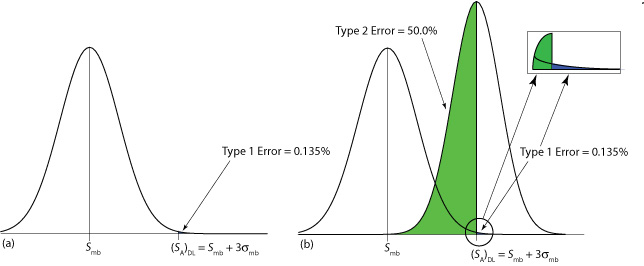
The figure below shows the probability of type 1 and type 2 errors for the IUPAC detection limit. (a) The normal distribution curve for the method blank, with a signal for the blank of zero (Smb = 0) and a unit standard deviation (σmb = 1). The minimum detectable signal for the analyte, (SA)DL, has a type 1 error of 0.135%. (b) The normal distribution curve for the analyte at its detection limit, (SA)DL = 3, is superimposed on the normal distribution curve for the method blank. The standard deviation for the analyte’s signal, σA, is 0.8. The area in green represents the probability of a type 2 error, which is 50%. The inset shows, in blue, the probability of a type 1 error, which is 0.135%.

