
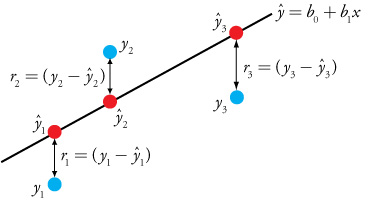
The figure here illustrates the basis of a linear regression analysis. The points in blue are the experimental data and the points in red are the predicted values from the regression equation. The difference between the two points is the residual error, which is given by the variable r. The total residual error, R, is the sum of the square of the individual residual errors. The smaller the value of R, the better the fit of the straight-line to the data. Note that the linear regression analysis assumes that all experimental uncertainty is in the form of indeterminate errors affecting the the values of y.
Residual Errors in a Linear Regression Analysis


About the Author

David Harvey
David T. Harvey is a Professor Emeritus of Chemistry and Biochemistry at DePauw University in Greencastle, Indiana, where he has been a dedicated faculty member since 1986. Over his nearly four-decade career, Dr…
View contributions