
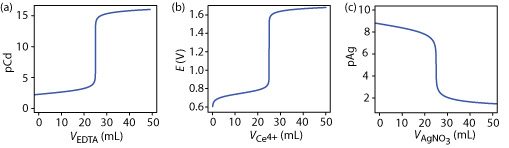
Examples of titration curves: (a) complexation titration of 25.0 mL of 1.0 mM Cd2+ with 1.0 mM EDTA at a pH of 10 in which the y-axis displays the titrand’s equilibrium concentration as pCd; (b) redox titration of 25.0 mL of 0.050 M Fe2+ with 0.050 M Ce4+ in 1 M HClO4, in which the y-axis displays the titration mixture’s electrochemical potential, E, which, through the Nernst equation is a logarithmic function of concentrations; (c) precipitation titration of 25.0 mL of 0.10 M NaCl with 0.10 M AgNO3 in which the y-axis displays the titrant’s equilibrium concentration as pAg.
Complexation, Redox, and Precipitation Titration Curves


About the Author

David Harvey
David T. Harvey is a Professor Emeritus of Chemistry and Biochemistry at DePauw University in Greencastle, Indiana, where he has been a dedicated faculty member since 1986. Over his nearly four-decade career, Dr…
View contributions